Inventory & Purchasing
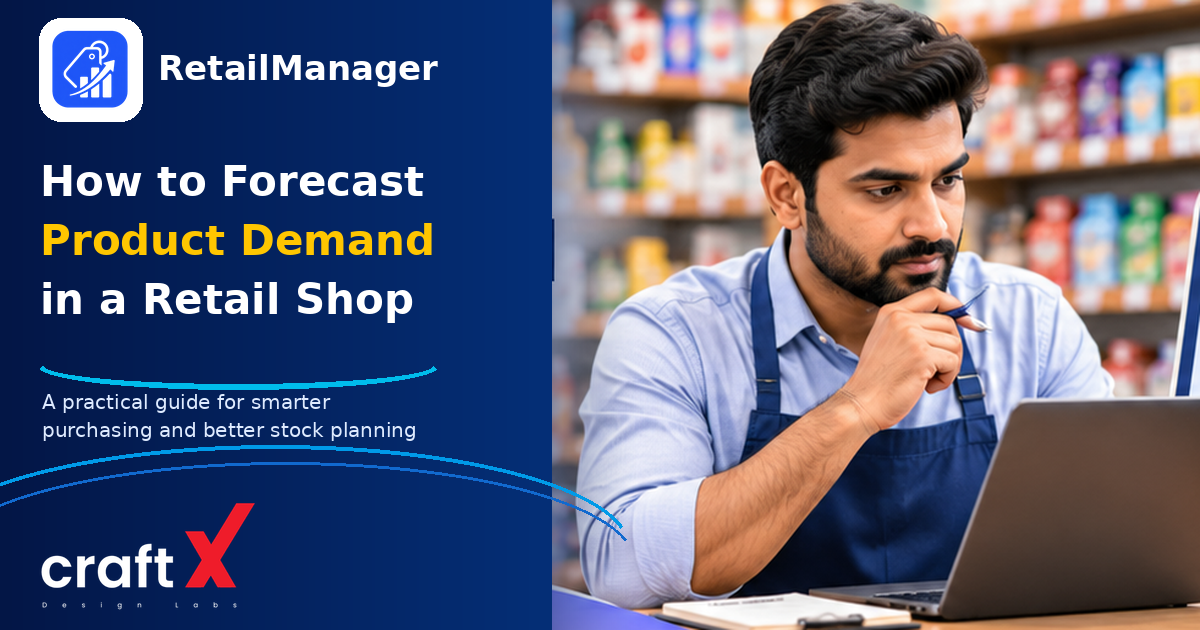
How to Forecast Product Demand in a Retail Shop: A Practical Guide
Learn how to forecast product demand in your retail shop using past sales, seasonal trends and customer buying patterns to plan purchases effectively.
Introduction
Retail demand forecasting helps shop owners estimate how many products customers are likely to purchase in the coming days, weeks or months. Instead of ordering products based only on guesswork, retailers can use previous sales, customer buying patterns, seasonal changes and local events to make better purchasing decisions.
Imagine you own a grocery shop in Andhra Pradesh. During normal months, you sell around 40 bottles of a particular cold beverage every week. When summer approaches, demand may increase. If you purchase the same quantity throughout the year, you may run out of stock when customers need the product most.
On the other hand, purchasing too much can leave money tied up in unsold inventory, create storage problems and increase the risk of damage or expiry.
This is why forecasting matters.
Whether you operate a kirana store, pharmacy, clothing shop, hardware store, fertilizer business, supermarket or mobile accessories shop, understanding future demand can help you decide what to purchase, when to reorder and how much stock to maintain.
In this guide, we will explain practical demand forecasting methods for small retail shops, using simple formulas, Indian examples and an easy implementation plan.
1. What Is Retail Demand Forecasting?
Retail demand forecasting is the process of estimating how much of a product customers are likely to purchase during a future period.
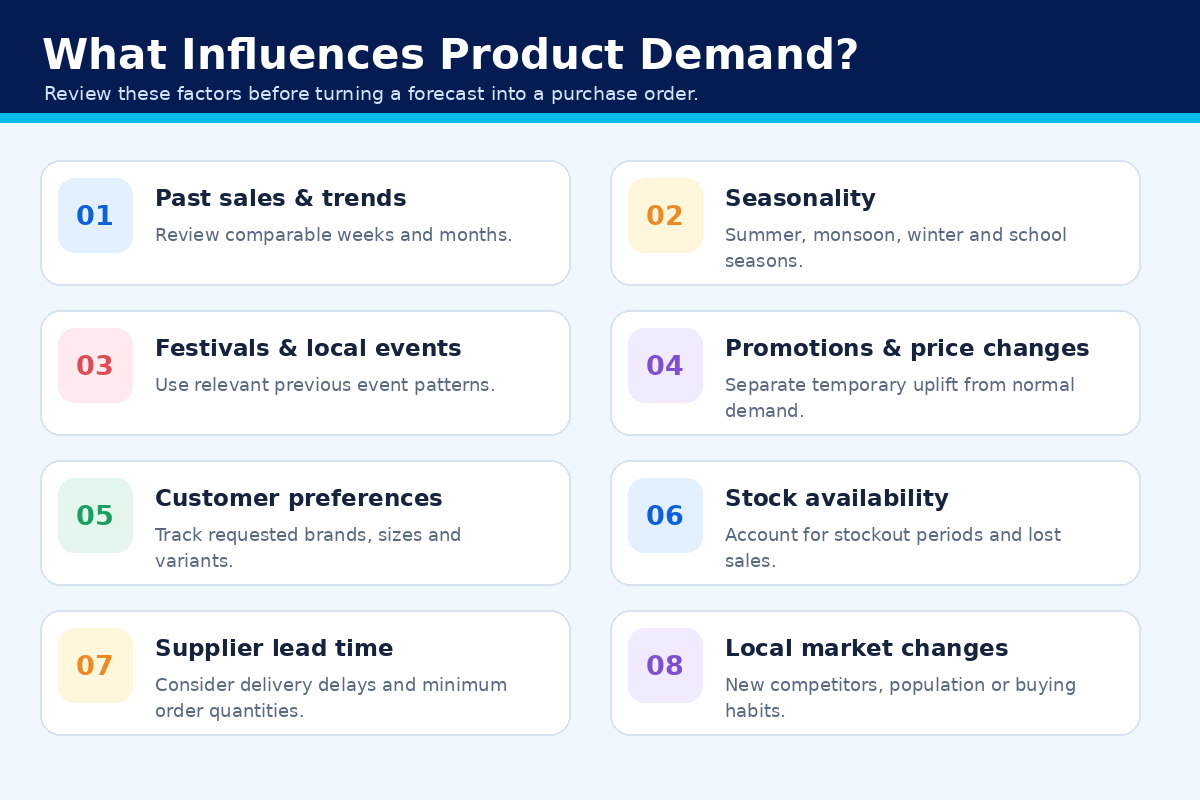
It uses available information such as:
- Previous sales quantities.
- Weekly and monthly sales patterns.
- Seasonal demand.
- Festivals and local events.
- Product prices and promotional offers.
- Customer requests.
- Supplier availability.
- Changes in the local market.
For example, a clothing store may use previous summer sales to estimate the demand for cotton shirts during the coming summer.
A grocery shop may review previous festival sales before purchasing sweets, snacks and cooking essentials.
A mobile accessories shop may use customer requests and recent phone launches to estimate demand for new cases and screen protectors.
The objective is not to predict every sale perfectly. It is to make a more informed estimate than simply purchasing products based on assumptions.
Demand forecasting vs demand planning
These two activities are related but have different purposes.
| Activity | Meaning |
|---|---|
| Demand forecasting | Estimating how much customers are likely to purchase |
| Demand planning | Using the forecast to decide purchasing, inventory and operational actions |
For example, forecasting may suggest that your shop will sell approximately 100 units of a product next month. Demand planning helps you decide how much to purchase based on current stock, pending orders and supplier delivery time.
2. Why Is Demand Forecasting Important for Small Retail Shops?
Small retailers often operate with limited investment, storage space and purchasing capacity.
Ordering too little can result in lost sales, while ordering too much can create unnecessary inventory.
Demand forecasting helps balance these situations.
A. Reduce unexpected stock shortages
When you understand expected demand, you can prepare for periods when customers are likely to purchase more products.
For example, a shop near a school may experience increased demand for notebooks, pens and school bags before the academic year begins.
B. Avoid unnecessary purchases
Forecasting helps you identify products that may not require large replenishment orders.
Instead of ordering the same quantity every month, you can adjust purchases according to expected customer demand.
C. Improve cash flow
Money spent on unnecessary inventory cannot be used for supplier payments, operating expenses or other business requirements.
Planning purchases around expected demand can help you allocate your available investment more carefully.
For more guidance, read Cash Flow Management for Small Retail Shops in India.
D. Prepare for seasonal opportunities
Demand may change during summer, monsoon, winter, festivals, school reopening periods and local celebrations.
Forecasting helps shop owners prepare before these changes happen.
E. Improve supplier coordination
When you understand your expected purchasing requirements, you can communicate with suppliers earlier and discuss delivery schedules, availability and quantities.
This is particularly useful when suppliers need several days to deliver products.
3. Collect the Right Sales Information Before Forecasting
A useful forecast begins with reliable information.
You do not need advanced analytics software. A basic spreadsheet or sales register can be enough for a small retail shop.
Start by collecting the following information.
A. Previous product sales
Record how many units of each product were sold during a consistent period.
For example:
| Product | Week 1 | Week 2 | Week 3 | Week 4 |
|---|---|---|---|---|
| Cooking oil (1 L) | 35 | 38 | 36 | 41 |
| Biscuits | 90 | 95 | 88 | 102 |
| Detergent (1 kg) | 22 | 25 | 23 | 26 |
| Cold beverages | 40 | 45 | 48 | 57 |
This information helps identify products with stable, increasing or changing demand.
B. Current inventory
Previous sales alone are not sufficient.
You should also know:
- How much stock is currently available.
- Whether additional stock has already been ordered.
- Whether any products are damaged or unavailable for sale.
- Whether products have expiry or storage restrictions.
C. Seasonal sales information
Some products sell differently depending on the time of year.
Keep records of sales during:
- Summer.
- Monsoon.
- Winter.
- Festival periods.
- School reopening periods.
- Local events and market seasons.
Comparing similar periods can provide better estimates than comparing unrelated months.
D. Customer requests
Not every demand signal appears in completed sales.
Customers may request products that are unavailable in your shop.
Record repeated requests for missing products, preferred brands, sizes, colours and variants.
This information is especially useful when introducing new products or estimating demand for items with limited sales history.
E. Promotions and price changes
A special offer may temporarily increase product sales.
Record when promotions happen so that unusually high sales are not automatically treated as normal demand for every future week.
4. Simple Demand Forecasting Methods for Small Retailers
You can use different forecasting methods depending on the information available and the product's demand pattern.
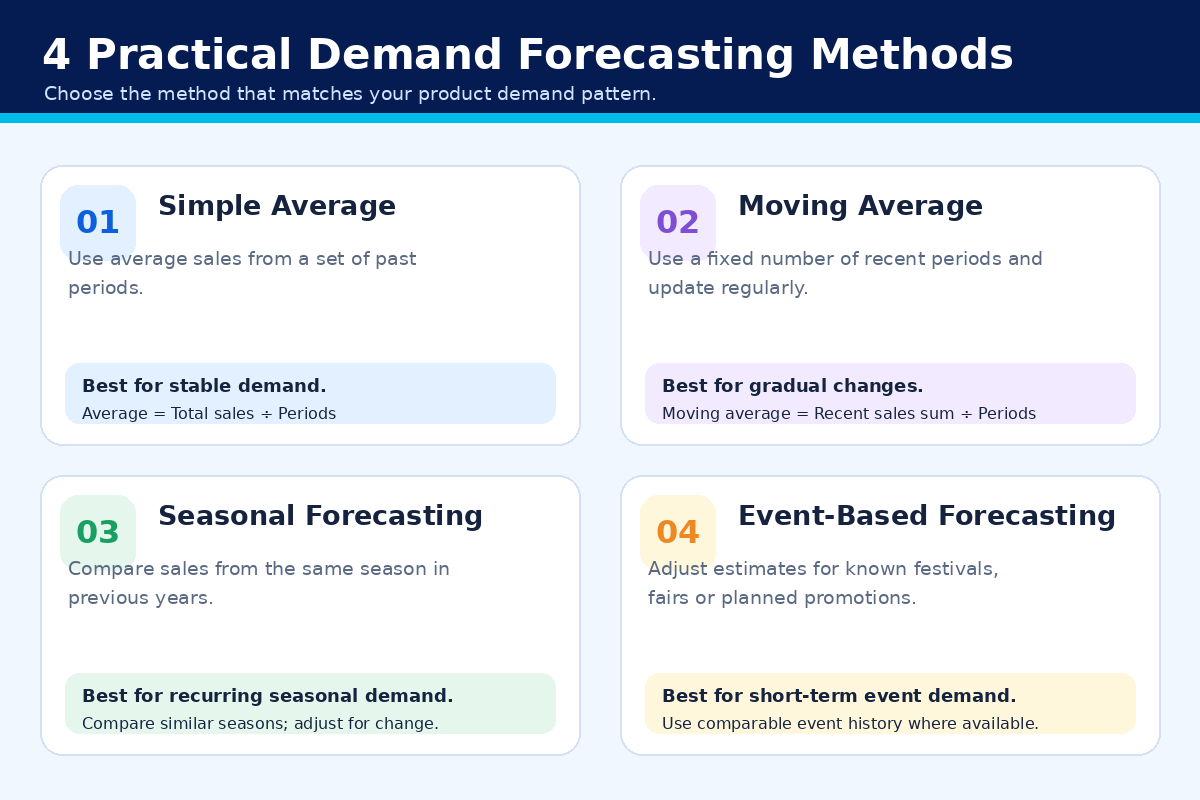
Method 1: Simple Average Method
This is one of the easiest ways to estimate future demand.
Calculate the average quantity sold during a selected historical period.
Average Weekly Demand = Total Units Sold ÷ Number of Weeks
Example:
A grocery shop sold the following quantities of cooking oil over four weeks:
| Week | Units sold |
|---|---|
| Week 1 | 35 |
| Week 2 | 38 |
| Week 3 | 36 |
| Week 4 | 41 |
| Total | 150 |
Average weekly demand:
150 ÷ 4 = 37.5 units.
The shop can use approximately 38 units as a starting estimate for the next normal week.
This method works best when demand is reasonably stable.
Method 2: Moving Average Method
A moving average uses a fixed number of recent periods to calculate expected demand.
It is useful when you want your forecast to respond gradually to recent changes.
Suppose a shop records the following weekly sales:
| Week | Units sold |
|---|---|
| Week 1 | 40 |
| Week 2 | 46 |
| Week 3 | 42 |
| Week 4 | 52 |
The four-week moving average is:
(40 + 46 + 42 + 52) ÷ 4 = 45 units.
The baseline forecast for the next comparable week is 45 units.
As each new week's sales become available, replace the oldest week with the latest week and calculate the average again.
A moving average is easy to maintain, but it may respond slowly when demand changes suddenly.
Method 3: Seasonal Forecasting
Some products experience predictable increases or decreases in demand during particular seasons.
For example:
| Period | Products that may experience higher demand |
|---|---|
| Summer | Cold beverages, ice creams and summer essentials |
| Monsoon | Umbrellas, raincoats and waterproof products |
| School reopening | Notebooks, pens, bags and stationery |
| Festivals | Sweets, decorations, gifts and seasonal items |
| Winter | Warm clothing and seasonal products |
For seasonal forecasting, compare the same period across previous years whenever reliable records are available.
For example, if your shop sold 200 units of a particular product during the previous summer, that can be a useful reference when preparing for the next summer.
However, check whether prices, product availability, promotions and local conditions have changed before using the previous figure.
Method 4: Event-Based Forecasting
Demand can increase because of events that do not follow an ordinary weekly or monthly pattern.
Examples include:
- A local temple festival.
- A school reopening.
- A nearby market event.
- A wedding season.
- A planned promotional campaign.
- A new residential area opening nearby.
Use previous experience, customer enquiries and confirmed event information to estimate the possible change in demand.
Do not assume every event will increase sales by the same percentage. Make your assumptions clear and review them after the event.
Method 5: Customer and Market-Based Forecasting
Sometimes you do not have enough sales history.
This is common when:
- Opening a new shop.
- Introducing a new product.
- Expanding into a new category.
- Selling products with short life cycles.
- Serving a new customer group.
In these situations, use other information:
- Customer requests.
- Sales of similar products.
- Supplier feedback.
- Local competitor observations.
- Small trial purchases.
- Initial sales after product introduction.
For new products, start with a manageable quantity and adjust future purchases using actual results.
5. Practical Retail Demand Forecasting Example
Let's understand how a small retailer can forecast demand before placing a purchase order.
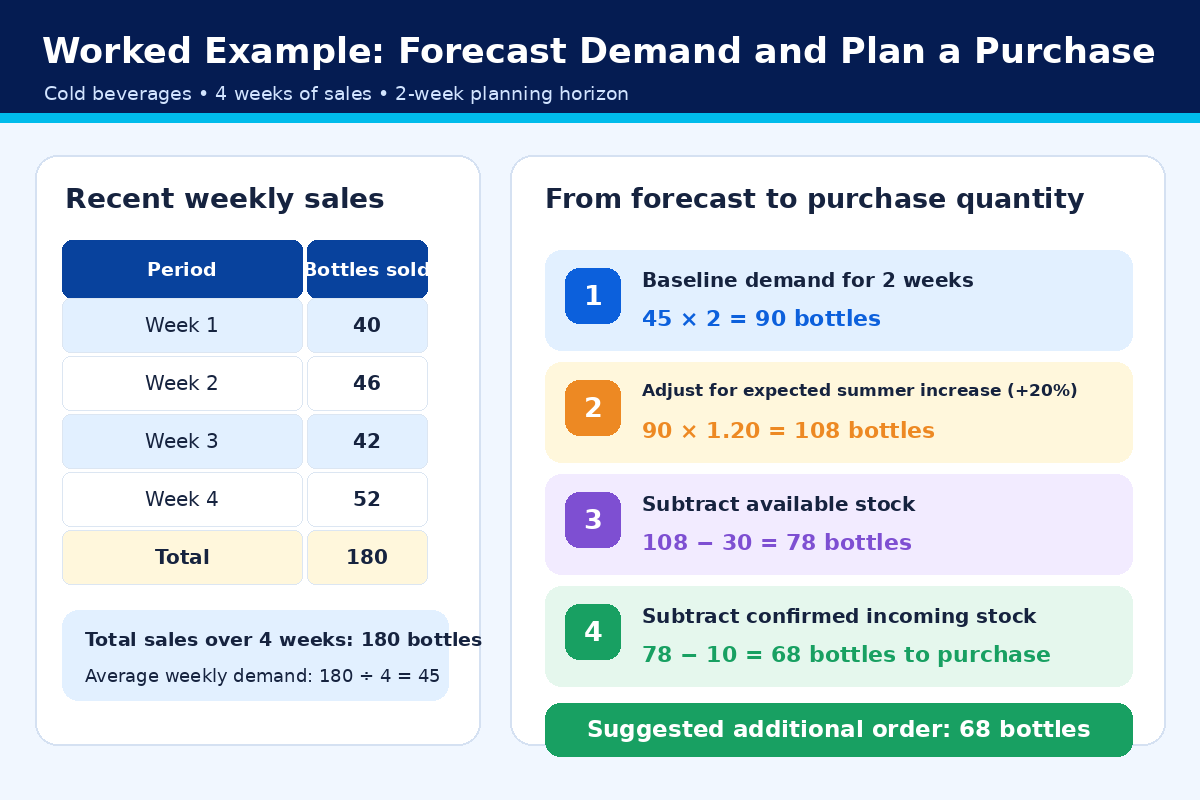
Imagine a shop selling cold beverages.
The owner wants to estimate the number of bottles required for the next two weeks.
The recorded sales for the last four weeks are:
| Week | Bottles sold |
|---|---|
| Week 1 | 40 |
| Week 2 | 46 |
| Week 3 | 42 |
| Week 4 | 52 |
| Total | 180 |
Step 1: Calculate average weekly sales
Average weekly demand:
180 ÷ 4 = 45 bottles.
Step 2: Calculate baseline demand for two weeks
45 × 2 = 90 bottles.
The baseline forecast is 90 bottles for the next two weeks, assuming similar conditions.
Step 3: Consider an expected demand increase
Suppose summer is approaching and the owner expects demand to increase by 20%.
This percentage is an illustrative planning assumption. Ideally, the owner should estimate it using previous summer sales or comparable events.
Adjusted forecast:
90 × 1.20 = 108 bottles.
The estimated demand for the next two weeks is approximately 108 bottles.
Step 4: Review current inventory
Suppose the shop has:
- Available stock: 30 bottles.
- Confirmed incoming stock: 10 bottles.
- Forecast demand: 108 bottles.
Additional quantity needed to cover the forecast period:
108 − 30 − 10 = 68 bottles.
The shop may plan to purchase approximately 68 additional bottles, subject to supplier packaging quantities, delivery schedule, storage capacity and the next review date.
Important considerations
This calculation is a simplified planning example.
Before placing the order, also consider:
- Whether demand is expected to change again.
- Supplier delivery time.
- Minimum order quantity.
- Available shelf and storage space.
- Product shelf life.
- Existing customer orders.
- Available purchasing budget.
Forecasted demand is an estimate, not a guaranteed number of sales.
6. Understand Sales Trends and Avoid Incorrect Forecasts
A product's sales history may contain unusual changes.
If you use historical data without understanding why sales changed, your forecast may be misleading.
A. Identify increasing demand
If sales increase consistently over several comparable periods, investigate whether demand is genuinely growing.
For example:
| Month | Units sold |
|---|---|
| January | 100 |
| February | 115 |
| March | 130 |
| April | 145 |
The figures show an upward pattern.
However, check whether the increase resulted from a promotion, additional stock availability, price changes or an actual rise in customer demand.
B. Identify decreasing demand
If sales decline over multiple periods, investigate the reason.
Possible causes include:
- Changing customer preferences.
- New competitors.
- Higher product prices.
- Seasonal changes.
- Reduced product availability.
- Product replacement or discontinuation.
Do not automatically reduce purchases without understanding the cause.
C. Account for stockout periods
This is particularly important.
Suppose a product sells 50 units in a week, but the shop runs out of stock on Thursday.
The remaining days show zero recorded sales because the product was unavailable.
Those zero-sales days should not automatically be interpreted as zero customer demand.
When forecasting, record the periods during which the product was unavailable and consider customer requests, previous sales patterns and similar periods to estimate the demand that could not be fulfilled.
Research into retail forecasting also identifies stockouts, seasonality and promotional information as important data considerations. <Link ref="turn582345search0" title="Retail forecasting: Research and practice"/>.
D. Separate promotional sales from normal sales
Suppose a product usually sells 40 units per week.
During a special offer, it sells 90 units.
The 90-unit week should not automatically become the new normal forecast.
Record promotional periods separately and assess whether similar offers are planned again.
7. Turn Your Demand Forecast into a Purchasing Plan
A forecast becomes useful when you translate it into purchasing decisions.
After estimating expected demand, compare it with available and incoming inventory.
A simple purchasing estimate is:
Suggested Order Quantity = Expected Demand During the Planning Period + Required Buffer − Available Stock − Confirmed Incoming Stock
The required buffer should reflect demand uncertainty, supplier reliability and the consequences of running out of the product.
Example
Suppose:
| Particulars | Quantity |
|---|---|
| Expected demand | 120 units |
| Planned buffer | 15 units |
| Available stock | 35 units |
| Confirmed incoming stock | 20 units |
Suggested order quantity:
120 + 15 − 35 − 20 = 80 units.
The shop may plan to purchase 80 units, after checking carton quantities, supplier minimums, budget and storage requirements.
The buffer is a planning allowance, not a universal fixed percentage. A product with reliable supply and stable demand may require a smaller buffer than one with unpredictable demand or long delivery times.
For more detailed guidance on timing purchases and preventing shortages, read How to Manage Stock and Prevent Stockouts in a Retail Shop.
8. How to Forecast Demand for Different Retail Businesses
The information you use for forecasting depends on your shop type.
Kirana stores
Focus on:
- Weekly and monthly grocery sales.
- Festival-related demand.
- Summer and monsoon products.
- Frequently purchased household essentials.
- Pack sizes and brand preferences.
Compare previous festival periods when planning seasonal purchases.
Pharmacies
Consider:
- Regular product movement.
- Seasonal healthcare demand.
- Prescription-related demand patterns.
- Supplier lead times.
- Batch and expiry information.
- Applicable storage and regulatory requirements.
Do not use a general seasonal forecast as a substitute for professional judgement or applicable pharmaceutical requirements.
Clothing stores
Clothing demand can vary significantly by season, size, colour, design and occasion.
Track products at the relevant variant level rather than combining different sizes and designs into one total.
Consider:
- Previous seasonal sales.
- Wedding and festive periods.
- School and college requirements.
- Local customer preferences.
- New collections and changing trends.
Hardware stores
Consider:
- Contractor and project requirements.
- Local construction activity.
- Weather-related demand.
- Regular maintenance and repair needs.
- Supplier delivery schedules.
Customer enquiries and known project requirements can help when historical sales alone are insufficient.
Mobile accessories stores
Consider:
- Popular phone models.
- New device launches.
- Screen protector and case compatibility.
- Charging accessory demand.
- Customer enquiries.
- Changes in device preferences.
Forecast at the model or compatibility level when different variants are not interchangeable.
9. Common Demand Forecasting Mistakes to Avoid
A forecast can be useful, but only when its assumptions are reasonable.
Avoid these common mistakes.
Mistake 1: Using only one week's sales
A single week may contain unusual demand, a special offer or a temporary supply problem.
Review several comparable periods wherever possible.
Mistake 2: Treating all products equally
Some products have stable demand, while others are seasonal or unpredictable.
Choose the forecasting method according to the product's behaviour.
Mistake 3: Ignoring unavailable stock
A product that was unavailable cannot record normal sales.
Identify stockout periods before interpreting low sales as low demand.
Mistake 4: Assuming last year's demand will repeat exactly
Customer preferences, competition, prices and local conditions may change.
Previous periods are useful references, not guarantees.
Mistake 5: Overreacting to a sudden increase
A one-time promotion or local event may temporarily increase sales.
Do not permanently increase purchasing quantities without confirming that the increase is likely to continue.
Mistake 6: Ignoring supplier delivery time
A forecast tells you how much demand may occur. You must also consider how long it takes to receive additional stock.
A product with a longer supplier lead time needs earlier purchasing attention.
Mistake 7: Never reviewing forecast accuracy
Compare actual sales with the forecast after each period.
If your forecast is repeatedly too high or too low, investigate the assumptions and improve the method.
10. How to Measure Whether Your Forecast Is Working
Demand forecasting should improve as you collect more information.
A simple way to review performance is to compare the expected quantity with actual sales.
Forecast Error = Actual Sales − Forecast Sales
Example:
| Particulars | Quantity |
|---|---|
| Forecast sales | 100 units |
| Actual sales | 115 units |
| Forecast error | +15 units |
The positive difference means actual sales were 15 units higher than forecast.
If actual sales were 85 units instead, the forecast would have been 15 units higher than the actual sales.
Review these differences regularly.
Ask:
- Did an event increase demand?
- Was a product unavailable during the forecast period?
- Was a promotion responsible for higher sales?
- Did the supplier deliver late?
- Did customer preferences change?
- Was the original forecast based on too little information?
Do not judge a forecasting method using only one product or one week. Look at repeated patterns across suitable periods.
11. Use Retail Billing and Inventory Software to Support Forecasting
Manually collecting sales information becomes difficult when your shop has hundreds or thousands of products.
Retail billing and inventory software can help maintain the historical records needed for demand forecasting.
Depending on the available features, retailers can use it to:
- Maintain organised product records.
- Record daily sales quantities.
- Review product-level sales information.
- Track product categories.
- Record purchases and received quantities.
- Monitor current inventory.
- Review sales across different periods.
For example, a shop owner can use sales records to compare the last four weeks with the previous four weeks and identify products whose demand is increasing.
RetailManager, developed by CraftX Design Labs, helps small retailers manage products, billing, sales and inventory operations. These organised business records can provide a foundation for making more informed purchasing decisions.
Forecasting still requires the retailer to interpret seasonal changes, local events, promotions and other factors that influence customer demand. Do not assume that every forecasting calculation described in this article is an automated RetailManager feature.
Explore RetailManager by CraftX Design Labs to learn more.
12. A Practical 7-Day Demand Forecasting Plan
You can start forecasting demand with a spreadsheet and your existing sales records.
Follow this simple seven-day plan.
| Day | Activity | Expected outcome |
|---|---|---|
| Day 1 | Prepare your product list and collect recent sales records | Organised historical information |
| Day 2 | Identify products with stable and changing demand | Understand product behaviour |
| Day 3 | Calculate average weekly sales for selected products | Create baseline forecasts |
| Day 4 | Review seasonal patterns, promotions and local events | Adjust forecasts where justified |
| Day 5 | Compare forecasts with current and incoming stock | Identify purchasing requirements |
| Day 6 | Prepare a simple purchasing plan | Prioritise upcoming orders |
| Day 7 | Review assumptions and define the next forecast date | Establish a repeatable process |
Start with a small selection of important products rather than forecasting every item at once.
As your records improve, gradually expand the process.
Conclusion
Retail demand forecasting helps small shop owners move from guess-based purchasing towards more informed inventory decisions.
Start by collecting historical sales information, identifying patterns and calculating a simple average. Adjust your estimates only when you have a reasonable basis, such as seasonal history, planned promotions or known local events.
Compare the forecast with current stock, confirmed incoming purchases, supplier delivery time and available investment before placing orders.
Most importantly, review actual sales against your estimates and learn from the differences.
You do not need expensive forecasting software or advanced mathematical models to begin. A simple spreadsheet, accurate sales records and regular reviews can help you plan purchases more effectively.
By understanding what customers are likely to buy in the coming weeks and months, you can improve product availability, use your investment more carefully and build a more responsive retail business.
Frequently Asked Questions (FAQs)
1. What is retail demand forecasting?
Retail demand forecasting is the process of estimating how many units of a product customers are likely to purchase during a future period. It uses historical sales, seasonal patterns, customer preferences and other relevant information.
2. How can a small retail shop forecast product demand?
Start by reviewing recent product sales, calculating average weekly demand, identifying seasonal changes and recording customer requests. Compare the estimate with current inventory and incoming purchases before preparing an order.
3. Which demand forecasting method is best for small shops?
A simple average or moving average is a practical starting point for products with reasonably stable sales. Seasonal comparisons and customer feedback can help when demand changes during particular periods or when historical data is limited.
4. How much historical sales data is required for demand forecasting?
A few weeks of data can help create an initial estimate, but several months provide more context. For products with seasonal demand, comparing the same period from previous years can be particularly useful.
5. How do festivals affect retail demand forecasting?
Festivals can change product preferences, quantities purchased and shopping frequency. Retailers should review previous comparable festival periods, customer requests, supplier availability and planned offers before adjusting their forecast.
6. Can demand forecasting prevent stockouts?
Demand forecasting can help retailers estimate future requirements, but it cannot guarantee product availability. It should be combined with current stock monitoring, reorder planning and reliable supplier coordination.
7. How often should a retail shop update its demand forecast?
Fast-moving products may benefit from weekly reviews. Other products can be reviewed monthly or according to their selling patterns. Update forecasts whenever important changes occur, such as promotions, local events or supplier disruptions.
8. Can inventory software help with demand forecasting?
Yes. Inventory and billing software can provide historical sales, purchase and stock records that support forecasting. Depending on the software, it may also offer analytical or automated forecasting features. Retailers should verify which features are available in their chosen system.
- #Retail Demand Forecasting
- #Inventory Forecasting
- #Retail Inventory Management
- #Sales Forecasting
- #Stock Planning
- #Retail Purchasing
- #Small Retail Business
- #Inventory Planning