Inventory & Purchasing
ABC Analysis for Inventory Management in a Retail Shop: A Practical Guide
Learn how to use ABC analysis to classify retail inventory, identify high-value products and prioritise stock monitoring and purchasing.
Introduction
Managing inventory is not just about knowing how many products are available in your shop. It is also about understanding which products deserve the most attention.
Some products may represent a large portion of your total inventory investment, while others may have a relatively small financial value. Treating every product with the same level of monitoring and purchasing control can consume time and make inventory management unnecessarily complicated.
This is where ABC analysis in inventory management becomes useful.
ABC analysis is an inventory classification method that groups products according to their annual consumption value. It helps retailers identify high-value products that require closer monitoring, medium-value products that need regular control, and lower-value products that can be managed using simpler procedures.
For example, a kirana store may sell rice, cooking oil, detergent, biscuits, toothpaste and matchboxes. Although some products sell in large quantities, others may account for a much larger share of the shop's inventory investment.
By classifying products based on their value, the shop owner can decide which items need more frequent reviews, careful purchasing and tighter stock controls.
Whether you operate a grocery store, pharmacy, hardware shop, clothing store or mobile accessories business, ABC analysis can help you make better use of your time and inventory investment.
In this guide, we will explain how ABC analysis works, how to calculate it using an Indian retail shop example and how to apply it to everyday inventory management.
1. What Is ABC Analysis in Inventory Management?
ABC analysis is a method of dividing inventory into three categories based on the annual consumption value of each product.
The three categories are:
- Category A: High-value inventory that requires close monitoring.
- Category B: Medium-value inventory that requires regular monitoring.
- Category C: Lower-value inventory that can generally be managed using simpler controls.
The basic idea is that not every product contributes equally to the total value of inventory consumed during a year.
For example:
A retail shop may sell thousands of low-cost packets of biscuits, but a smaller number of expensive electronic accessories may represent a significant portion of its inventory investment.
ABC analysis helps the shop owner identify these differences and prioritise management efforts.
What does annual consumption value mean?
Annual consumption value is calculated by multiplying the quantity of a product used or sold during a year by its average unit purchase cost.
Annual Consumption Value = Annual Usage Quantity × Average Unit Purchase Cost
For example:
- Annual quantity sold: 500 units
- Average purchase cost: ₹100 per unit
Annual consumption value:
500 × ₹100 = ₹50,000
This figure helps you understand how much inventory value moves through your business for that product over a year.
Remember that ABC analysis is based on inventory consumption value, not simply the selling price, total sales revenue or profit margin.
2. Understand the Three ABC Inventory Categories
Each ABC category needs a different level of attention.
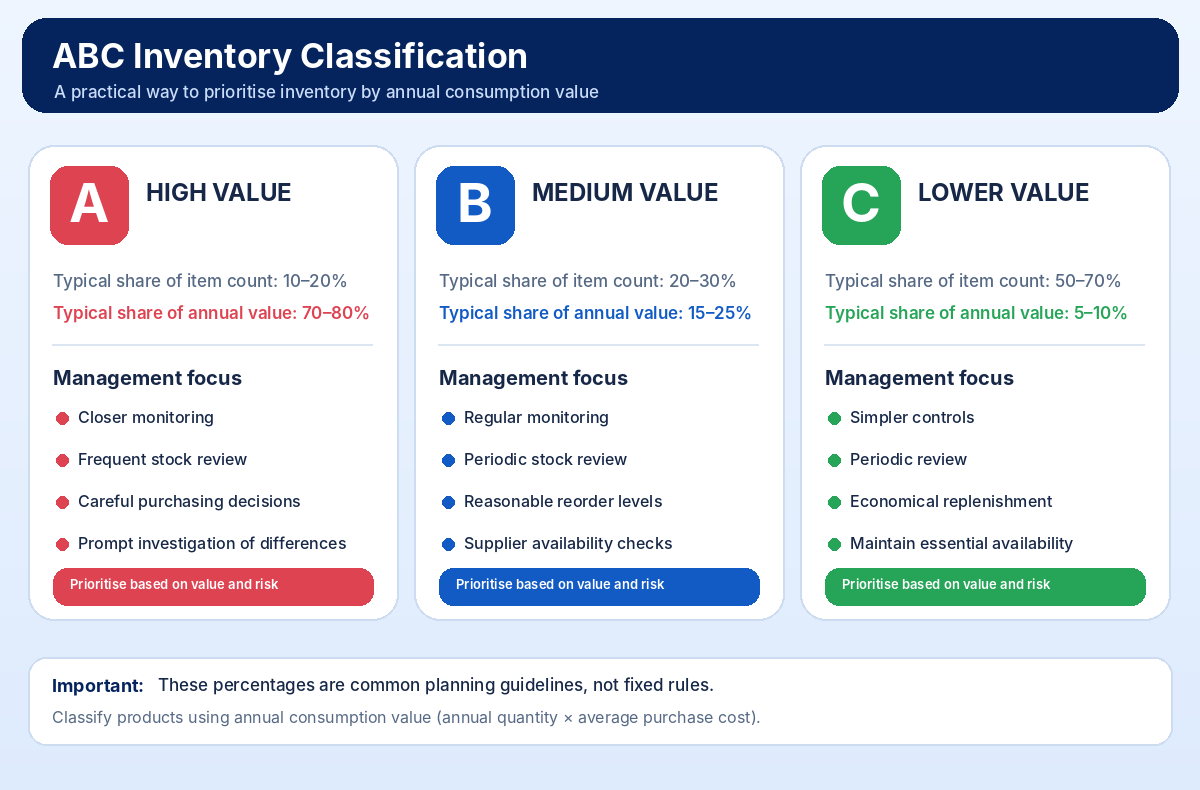
A Category – High-Value Products
A-category products account for a large share of the total annual inventory consumption value.
These products generally deserve closer purchasing and stock monitoring because mistakes involving them can have a greater financial impact.
Examples may include:
- Expensive electronics.
- Premium mobile accessories.
- High-value hardware products.
- Costly pharmaceutical inventory.
- Premium grocery products.
- Expensive clothing items.
Recommended management approach:
- Review stock levels frequently.
- Monitor sales and purchases closely.
- Check supplier prices regularly.
- Maintain appropriate reorder levels.
- Investigate unusual stock differences promptly.
- Avoid unnecessary purchases.
- Review demand before placing large orders.
A-category products should receive more management attention, even when their sales quantities are relatively low.
B Category – Medium-Value Products
B-category products fall between A and C in terms of annual consumption value.
They usually require regular monitoring but may not need the same level of attention as A-category products.
Examples might include:
- Regular personal care products.
- Common household supplies.
- Medium-priced accessories.
- Frequently purchased packaged goods.
Recommended management approach:
- Review stock periodically.
- Monitor purchase quantities.
- Maintain reasonable reorder levels.
- Check supplier availability.
- Review performance during monthly inventory checks.
C Category – Lower-Value Products
C-category products account for a comparatively smaller share of annual inventory consumption value.
They may include:
- Matchboxes.
- Low-cost stationery.
- Small household accessories.
- Low-cost packaging materials.
- Inexpensive consumables.
Recommended management approach:
- Use simpler stock-monitoring procedures.
- Purchase economical quantities where appropriate.
- Avoid spending excessive time on individual low-value items.
- Review stock periodically.
- Maintain enough availability for essential products.
However, lower financial value does not mean a product is unimportant. A low-cost product that customers regularly need may still require reliable availability.
3. How ABC Analysis Works: Understanding the 80/20 Principle
ABC analysis is often explained using the Pareto principle, commonly associated with the idea that a relatively small number of items can account for a large share of total value.
A frequently used starting point is:
| Category | Approximate share of item count | Approximate share of annual consumption value |
|---|---|---|
| A | 10–20% | 70–80% |
| B | 20–30% | 15–25% |
| C | 50–70% | 5–10% |
These are illustrative guidelines, not mandatory rules.
Your shop may have a different distribution depending on its products, prices, customer demand and business model.
For example, a mobile accessories store may have a different A-category distribution from a kirana store.
The objective is to classify products according to their contribution to total inventory consumption value rather than forcing every business to follow the same percentages.
4. How to Calculate ABC Analysis for a Retail Shop
Let's understand ABC analysis using a practical example.
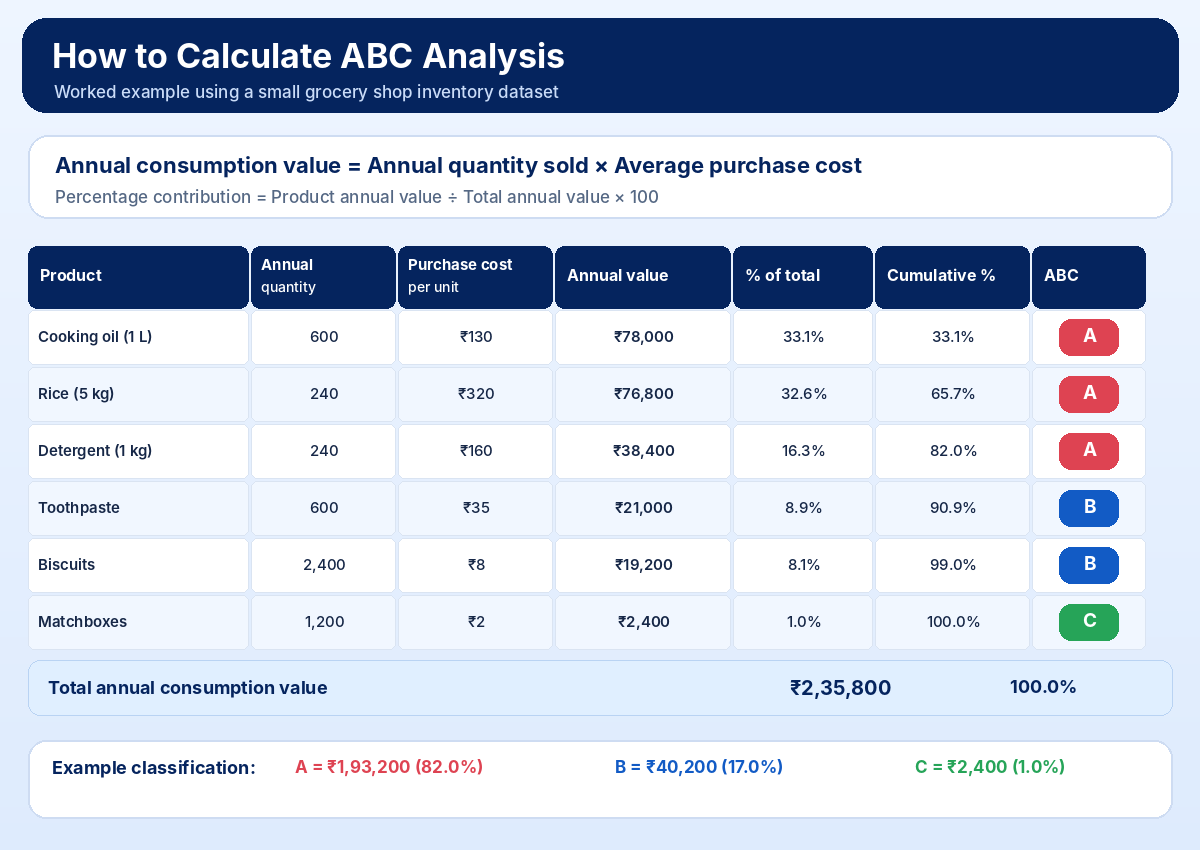
Imagine a small grocery store that sells cooking oil, rice, detergent, toothpaste, biscuits and matchboxes.
The shop owner wants to identify which products deserve closer inventory monitoring.
The owner collects the annual sales quantities and average purchase costs.
Step 1: Collect annual product usage data
Start by collecting the quantity sold or consumed for each product over a consistent 12-month period.
For this example:
| Product | Annual quantity sold | Average purchase cost |
|---|---|---|
| Cooking oil (1 L) | 600 | ₹130 |
| Rice (5 kg) | 240 | ₹320 |
| Detergent (1 kg) | 240 | ₹160 |
| Toothpaste | 600 | ₹35 |
| Biscuits | 2,400 | ₹8 |
| Matchboxes | 1,200 | ₹2 |
Use actual purchase costs rather than selling prices.
Step 2: Calculate annual consumption value
Apply the formula:
Annual Consumption Value = Annual Quantity × Average Purchase Cost
For example:
Cooking oil:
600 × ₹130 = ₹78,000
Rice:
240 × ₹320 = ₹76,800
Calculate the same value for every product.
| Product | Annual quantity | Purchase cost | Annual consumption value |
|---|---|---|---|
| Cooking oil | 600 | ₹130 | ₹78,000 |
| Rice | 240 | ₹320 | ₹76,800 |
| Detergent | 240 | ₹160 | ₹38,400 |
| Toothpaste | 600 | ₹35 | ₹21,000 |
| Biscuits | 2,400 | ₹8 | ₹19,200 |
| Matchboxes | 1,200 | ₹2 | ₹2,400 |
| Total | ₹2,35,800 |
Step 3: Calculate each product's percentage contribution
Use this formula:
Percentage Contribution = (Product Annual Consumption Value ÷ Total Annual Consumption Value) × 100
For cooking oil:
(₹78,000 ÷ ₹2,35,800) × 100 = 33.08%
This means cooking oil represents approximately 33.1% of the total annual consumption value in this example.
Step 4: Arrange products from highest to lowest value
Sort products according to their annual consumption value.
Then calculate the cumulative percentage.
| Product | Annual value | Percentage contribution | Cumulative percentage |
|---|---|---|---|
| Cooking oil | ₹78,000 | 33.1% | 33.1% |
| Rice | ₹76,800 | 32.6% | 65.7% |
| Detergent | ₹38,400 | 16.3% | 82.0% |
| Toothpaste | ₹21,000 | 8.9% | 90.9% |
| Biscuits | ₹19,200 | 8.1% | 99.0% |
| Matchboxes | ₹2,400 | 1.0% | 100.0% |
Step 5: Assign A, B and C categories
Based on the cumulative value and the shop's selected classification boundaries:
| Product | ABC category |
|---|---|
| Cooking oil | A |
| Rice | A |
| Detergent | A |
| Toothpaste | B |
| Biscuits | B |
| Matchboxes | C |
In this example:
- A-category products account for approximately 82% of annual consumption value.
- B-category products account for approximately 17%.
- C-category products account for approximately 1%.
The distribution is slightly different from the commonly used 80/20 example, which is perfectly acceptable.
The shop owner should use meaningful boundaries based on the actual inventory distribution rather than changing classifications simply to achieve fixed percentages.
5. How Should You Manage A, B and C Category Products?
Once products are classified, the next step is deciding how to manage each category.
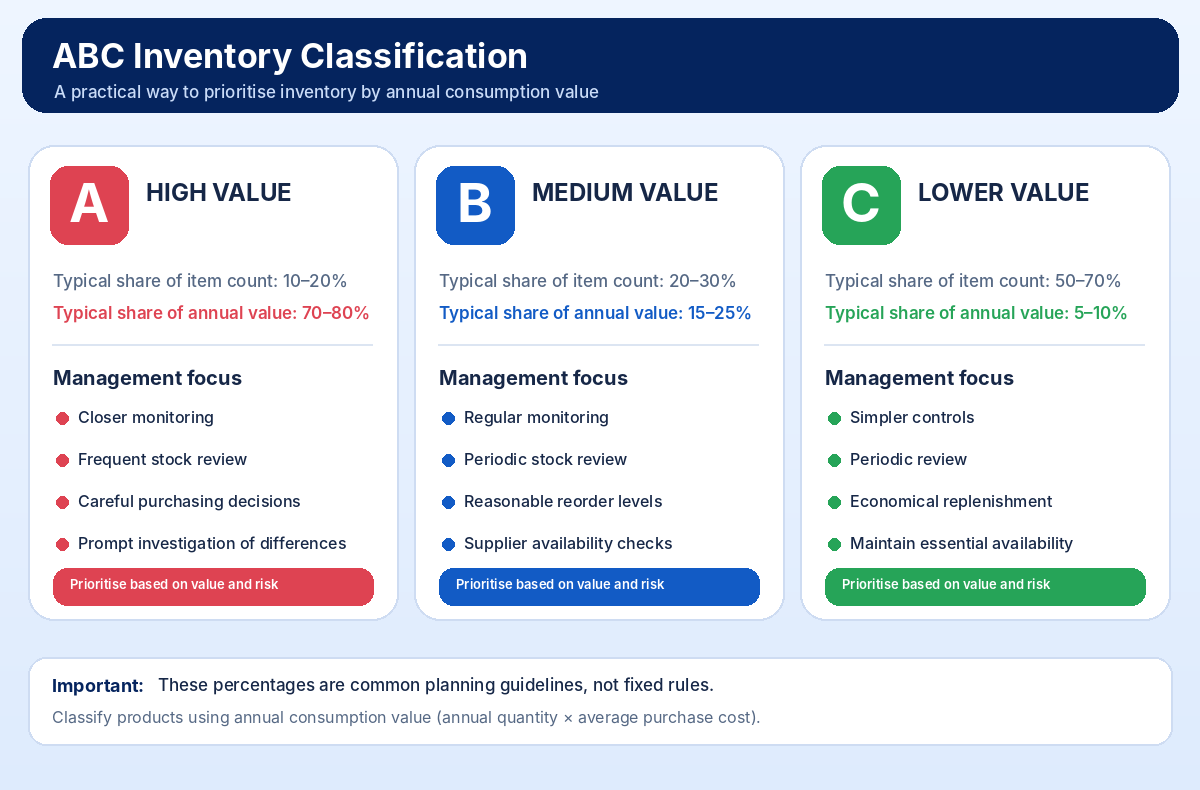
The value of ABC analysis comes from using the classification to improve purchasing, stock checks and inventory reviews.
A-category inventory management
A-category products deserve the highest level of attention.
Consider the following practices:
- Review stock frequently, such as weekly or more often when demand requires it.
- Monitor purchases and sales carefully.
- Check supplier reliability and price changes.
- Establish suitable reorder points.
- Investigate stock differences promptly.
- Avoid purchasing large quantities without considering demand and delivery lead time.
- Review high-value purchase decisions before approval.
For example, if cooking oil and rice account for a large share of your inventory investment, regularly checking their stock position can help prevent unnecessary capital from being tied up.
B-category inventory management
B-category products need regular but less intensive monitoring.
Consider:
- Reviewing stock every few weeks or monthly.
- Maintaining appropriate reorder levels.
- Comparing supplier prices periodically.
- Reviewing monthly product movement.
- Checking inventory during scheduled stock counts.
The review frequency should reflect how quickly products sell and how reliably suppliers deliver them.
C-category inventory management
C-category products can often be managed with simpler procedures.
Consider:
- Periodic stock reviews.
- Economical replenishment quantities.
- Basic inventory records.
- Combined ordering for suitable low-cost products.
- Less frequent detailed analysis when risk is low.
However, do not automatically purchase very large quantities just because products are inexpensive. Storage space, expiry, damage and cash flow still matter.
6. How ABC Analysis Helps with Purchasing Decisions
ABC analysis can help shop owners decide where to spend their purchasing attention.
Instead of reviewing every product with the same priority, focus first on products that represent a large share of annual inventory value.
Prioritise high-value purchases
Before ordering A-category products, review:
- Current stock quantity.
- Recent sales movement.
- Upcoming customer demand.
- Supplier lead time.
- Purchase price changes.
- Available investment.
- Existing pending orders.
This can help prevent unnecessary purchases.
Plan supplier discussions
A-category products may justify closer supplier discussions because changes in their purchase price can affect a larger portion of inventory expenditure.
You can compare supplier prices, delivery reliability and payment terms before committing to large orders.
For more guidance, read our article on How to Manage Supplier Purchases and Purchase Orders in a Retail Shop.
Avoid unnecessary complexity for C-category products
You may not need the same detailed approval process for every low-value purchase.
However, keep suitable records of what was ordered, received and paid for.
7. Combine ABC Analysis with Other Inventory Management Methods
ABC analysis becomes more useful when you use it alongside other inventory-control methods.
It answers one important question:
Which products represent the highest annual inventory consumption value?
Other methods answer different questions.
ABC Analysis and Inventory Turnover
ABC analysis identifies products based on annual consumption value.
Inventory turnover helps you understand how frequently inventory moves through your business.
A product may have a high annual consumption value but a slower movement pattern.
Combining these methods provides a better understanding of both financial importance and stock movement.
Read our guide on the Inventory Turnover Ratio for Retail Shops.
ABC Analysis and Stock Verification
ABC analysis can help you decide which products deserve more frequent physical verification.
For example:
- A-category products may need frequent checks.
- B-category products can be included in scheduled reviews.
- C-category products may be checked through periodic counts.
This is a suggested prioritisation approach, not a replacement for a complete stock-verification process.
Read How to Do Physical Stock Verification in a Retail Shop.
ABC Analysis and Reorder Levels
Reorder levels help determine when a product should be purchased again.
ABC classification helps determine how closely the product should be monitored.
For example, an A-category product may need more frequent stock reviews and closer purchasing oversight than a low-risk C-category item.
However, reorder quantities should still consider demand, supplier lead time, minimum order quantities and available investment.
For more guidance, read How to Manage Stock and Prevent Stockouts in a Retail Shop.
ABC Analysis and Expiry Management
ABC analysis does not replace expiry-date monitoring.
A low-value C-category product may still become a serious financial or compliance problem if it expires or cannot legally be sold.
For grocery stores and pharmacies, continue using suitable batch and expiry records alongside ABC classification.
Read How to Manage Expiry Dates and Batch Numbers in a Retail Shop.
8. Common Mistakes to Avoid When Using ABC Analysis
ABC analysis is relatively simple, but incorrect classification can lead to poor purchasing decisions.
Mistake 1: Classifying products only by selling price
ABC analysis should use annual consumption value calculated using purchase cost, not simply the retail selling price.
Using selling prices can distort the classification.
Mistake 2: Classifying products only by quantity sold
A product selling 2,000 units does not automatically deserve A classification.
A less frequently sold product may represent a much larger annual inventory value.
Consider both annual quantity and purchase cost.
Mistake 3: Ignoring important low-value products
Some C-category products may be essential for customer satisfaction.
For example, a low-cost commonly used accessory or household item may be important even if its annual consumption value is small.
Do not reduce its stock availability simply because it falls into Category C.
Mistake 4: Never updating the classification
Customer demand, supplier prices and product costs can change.
A product classified as A last year may become a B-category product after its demand falls.
Review ABC classifications periodically, such as quarterly or every six months, depending on the shop's size and sales activity.
Mistake 5: Treating ABC analysis as a complete inventory solution
ABC analysis does not automatically tell you:
- When a product will expire.
- Whether a product is profitable.
- Whether a supplier is reliable.
- How much safety stock is needed.
- Whether a product is essential to customers.
- Whether a product is likely to become dead stock.
Use it alongside other inventory-management methods.
9. How to Implement ABC Analysis in a Small Retail Shop
You do not need expensive software to start using ABC analysis.
A simple spreadsheet can be sufficient for a small shop.
Follow this process:
Step 1: Prepare your product list
Include each product or SKU separately. Avoid combining different variants with different costs into one line unless they are genuinely managed as the same inventory item.
Step 2: Collect annual sales quantities
Use a consistent historical period, preferably the most recent 12 months. For seasonal products, make sure the period includes the relevant selling season.
Step 3: Record average purchase cost
Use a consistent cost basis for each product. If purchase costs change significantly, calculate a suitable weighted average.
Step 4: Calculate annual consumption value
Multiply annual quantity by average purchase cost.
Step 5: Calculate the percentage contribution
Divide each product's annual consumption value by the total inventory consumption value.
Step 6: Sort products by value
Arrange the products from highest to lowest annual consumption value.
Step 7: Calculate cumulative percentages
Add each product's percentage contribution to the previous cumulative total.
Step 8: Assign categories
Choose suitable A, B and C boundaries based on your inventory distribution and business needs.
Step 9: Set review procedures
Decide how frequently each category should be checked and who is responsible.
Step 10: Review the classification periodically
Update the analysis when product demand, prices or the product range changes significantly.
10. How Inventory Software Can Support ABC Analysis
When a retail shop maintains hundreds or thousands of products, calculating annual consumption value manually can become time-consuming.
Retail billing and inventory software can help organise the information needed for analysis.
Depending on the available features, useful records may include:
- Product names and categories.
- Purchase quantities and costs.
- Sales quantities.
- Inventory movements.
- Supplier purchase details.
- Stock adjustments.
- Product-level sales reports.
Retailers can use suitable sales and purchase data to prepare an ABC analysis in a spreadsheet or reporting tool.
RetailManager, developed by CraftX Design Labs, helps small retailers manage products, billing, sales and inventory operations. Organised product and transaction records can provide a useful foundation for reviewing inventory performance.
The availability of particular reports or automated ABC classification depends on the software's implemented features, so verify the available reporting options before relying on a specific automation.
Explore RetailManager by CraftX Design Labs to learn more.
11. A Practical 7-Day ABC Analysis Implementation Plan
You can begin implementing ABC analysis without changing your entire inventory process.
| Day | Activity | Expected outcome |
|---|---|---|
| Day 1 | Export or prepare the complete product list | Organised inventory data |
| Day 2 | Collect annual sales quantities and purchase costs | Product-level annual usage information |
| Day 3 | Calculate annual consumption values | Understand product value contribution |
| Day 4 | Sort products and calculate cumulative percentages | Identify high-, medium- and low-value items |
| Day 5 | Assign A, B and C categories | Complete initial classification |
| Day 6 | Define review frequency and purchasing controls | Establish category-based procedures |
| Day 7 | Review the results and assign responsibilities | Prepare for ongoing implementation |
At the end of the first week, ask:
- Which products represent the largest share of inventory value?
- Are the A-category products being monitored regularly?
- Are purchasing decisions based on actual demand?
- Are C-category products still sufficiently available?
- Are product records accurate?
- When will the next ABC review take place?
Continue reviewing the classification periodically.
Conclusion
ABC analysis is a practical way to prioritise inventory management in a retail shop.
Instead of monitoring every product in exactly the same way, retailers can classify products according to their annual consumption value and give more attention to items that represent a larger share of inventory investment.
Start by collecting your annual sales quantities and average purchase costs. Calculate the annual consumption value, arrange products from highest to lowest value and assign A, B and C categories based on your shop's requirements.
Use the classification to improve stock monitoring, purchasing decisions and inventory reviews. Combine it with methods such as inventory turnover, physical stock verification, reorder planning and expiry management for a more complete approach.
You do not need a complicated system to get started. A well-maintained product list and a simple spreadsheet can help you understand where your inventory investment is concentrated.
The most effective inventory management is not about treating every product equally. It is about giving the right level of attention to the right products.
Frequently Asked Questions (FAQs)
1. What is ABC analysis in inventory management?
ABC analysis is an inventory classification method that groups products into A, B and C categories according to their annual consumption value. It helps businesses prioritise inventory monitoring and purchasing decisions.
2. What is the difference between A, B and C inventory?
A-category products represent a high share of annual inventory consumption value and require closer monitoring. B-category products have medium value and need regular controls. C-category products represent a smaller share of value and can often be managed with simpler procedures.
3. How do you calculate ABC analysis for inventory?
Multiply each product's annual usage quantity by its average purchase cost. Calculate each product's percentage of total annual consumption value, sort the products from highest to lowest and calculate cumulative percentages to assign categories.
4. Is ABC analysis suitable for small retail shops?
Yes. Small retail shops can use ABC analysis to identify products that represent a large share of their inventory investment. Even a basic spreadsheet can be used to classify products and plan stock reviews.
5. How often should ABC analysis be updated?
A quarterly or six-monthly review may be suitable for many shops. However, businesses with changing prices, seasonal demand or rapidly changing product ranges may benefit from more frequent reviews.
6. Does ABC analysis help prevent stockouts?
It can help prioritise monitoring for high-value products, but ABC analysis alone does not prevent stockouts. Retailers should also calculate reorder levels, monitor supplier lead times and review customer demand.
7. Should low-value C-category products be ignored?
No. Some low-value products are important for daily customer needs. C classification indicates a lower annual consumption value, not that a product is unnecessary. Maintain suitable availability based on demand and operational importance.
8. What is the difference between ABC analysis and inventory turnover?
ABC analysis classifies products according to annual consumption value, while inventory turnover measures how frequently inventory is sold or used and replenished over a period. Both methods provide different information and can be used together.
- #ABC Analysis
- #Inventory Management
- #Retail Inventory Control
- #Inventory Classification
- #Stock Management
- #Retail Purchasing
- #Small Retail Business
- #Inventory Planning